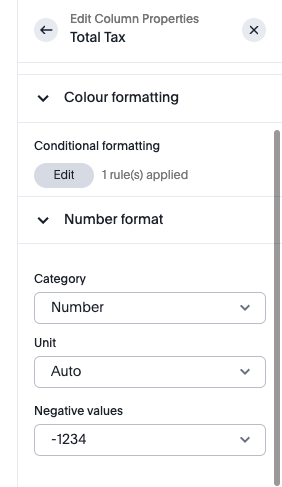
Format Your Numbers
With TS-Chart-SDK, you can format data based on the number formatting configurator that we provide in column-level settings. Currently, with the SDK, we support number formatting for measure-type values only.
Number Formatting Utilities
We also provide utilities to perform number formatting in the SDK. You can use these utilities directly to get the formatting as it is done in ThoughtSpot. If you want to customize your number formatting, you can do so by creating your own number formatting utilities based on the number formatting config that we send.
Enabling Number Formatting
Let's go through the step-by-step process of how to enable number formatting and how to use it with our homemade utilities.
Step 1: Enable Number Formatting
First, you need to enable number formatting while initializing the context with the following parameters. You can refer to allowedConfiguration to see more details on allowedConfiguration.
const ctx = await getChartContext({
  // initialize other params
  allowedConfiguration: {
    numberFormatting: true,
  },
  // initialize other params
});
Step 2: Access Number Formatting in ChartModel
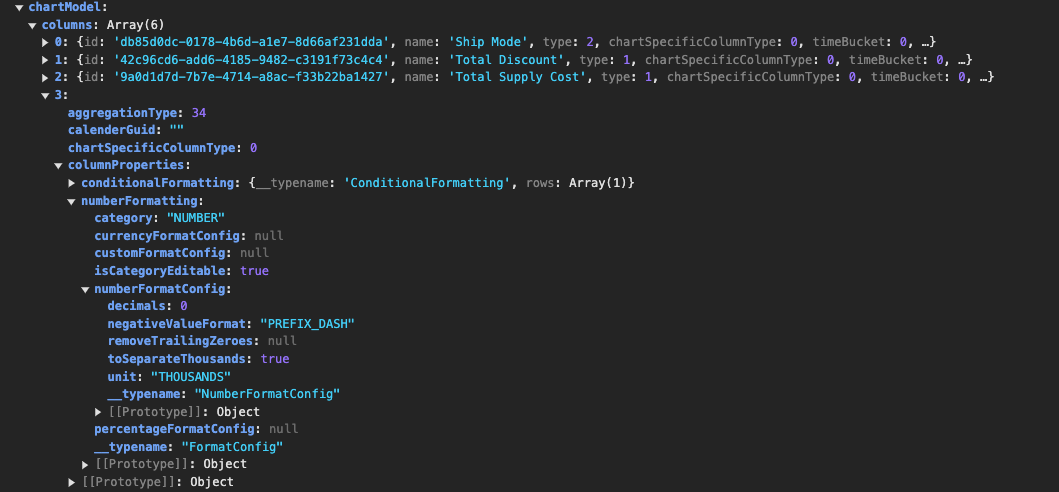
Now that you have enabled number formatting, you will get numberFormatConfig in the chartModel under AnswerColumn. Inside this, you will get multiple formatting options such as currencyFormatConfig, percentageFormatConfig, and numberFormatConfig based on the type that you have selected in the number formatting configurator.
Here is how it will look inside the chartModel.
Step 3: Pass Locale Information
Now comes the part of passing this numberFormattingConfig to work with the SDK utilities. But before that, we need to pass locale information to the SDK to get the correct number formatting based on your locale and also get default number formatting if no locale is selected from the configurator.
You can do so by extracting the locale from AppConfig and passing it to the initGlobalize function in the following way:
import { initGlobalize } from "@thoughtspot/sdk";
// other code.
const renderChart = async (ctx) => {
  const chartModel = ctx.getChartModel();
  const appConfig = ctx.getAppConfig();
  appConfigGlobal = appConfig;
  initGlobalize(appConfig.localeOptions?.locale);
  // other code.
};
NOTE: This locale is based on the locale that you select in ThoughtSpot.
Step 4: Use getFormattedValue Utility
Now you can use the getFormattedValue utility of our SDK to do further formatting. This function needs three parameters: the first is your value you want to format, the second is the numberFormattingConfig that you will get from chartModel, and the third is columnFormat, which is column-level formatting that will be used if numberFormattingConfig is not provided.
The best place to call this is inside your getColumnDataModel function.
function getColumnDataModel(
  configDimensions, // you can config dimension using chartModel.config?.chartConfig?.[0].dimensions
  dataArr: DataPointsArray,
  type,
  visualProps: VisualProps,
  customStyleConfig: ChartSdkCustomStylingConfig
) {
  const xAxisColumns = configDimensions?.[0].columns ?? [];
  const yAxisColumns = configDimensions?.[1].columns ?? [];

  return {
    // other function in getColumnDataModel
    getDatasets: () =>
      _.map(yAxisColumns, (col, idx) => {
        const coldata = getDataForColumn(col, dataArr);
        return {
          formatter: (value) => {
            return getFormattedValue(
              // here we are using the getFormattedValue utility to format the value.
              value,
              col.columnProperties.numberFormatting,
              col.format
            );
          },
        };
      }),
  };
}
You can visit custom-bar-chart-example to see the detailed implementation of this.